Numerical linear algebra

In [1]:
versioninfo()
Julia Version 1.7.1
Commit ac5cc99908 (2021-12-22 19:35 UTC)
Platform Info:
  OS: macOS (x86_64-apple-darwin19.5.0)
  CPU: Intel(R) Core(TM) i7-6920HQ CPU @ 2.90GHz
  WORD_SIZE: 64
  LIBM: libopenlibm
  LLVM: libLLVM-12.0.1 (ORCJIT, skylake)
Environment:
  JULIA_EDITOR = code
  JULIA_NUM_THREADS = 4

Introduction

  • Topics in numerical algebra:

    • BLAS
    • solve linear equations $\mathbf{A} \mathbf{x} = \mathbf{b}$
    • regression computations $\mathbf{X}^T \mathbf{X} \beta = \mathbf{X}^T \mathbf{y}$
    • eigen-problems $\mathbf{A} \mathbf{x} = \lambda \mathbf{x}$
    • generalized eigen-problems $\mathbf{A} \mathbf{x} = \lambda \mathbf{B} \mathbf{x}$
    • singular value decompositions $\mathbf{A} = \mathbf{U} \Sigma \mathbf{V}^T$
    • iterative methods for numerical linear algebra
  • Except for the iterative methods, most of these numerical linear algebra tasks are implemented in the BLAS and LAPACK libraries. They form the building blocks of most statistical computing tasks (optimization, MCMC).

  • Our major goal (or learning objectives) is to

    1. know the complexity (flop count) of each task
    2. be familiar with the BLAS and LAPACK functions (what they do)
    3. do not re-invent wheels by implementing these dense linear algebra subroutines by yourself
    4. understand the need for iterative methods
    5. apply appropriate numerical algebra tools to various statistical problems
  • All high-level languages (R, Matlab, Julia) call BLAS and LAPACK for numerical linear algebra.

    • Julia offers more flexibility by exposing interfaces to many BLAS/LAPACK subroutines directly. See documentation.

BLAS

  • BLAS stands for basic linear algebra subprograms.

  • See netlib for a complete list of standardized BLAS functions.

  • There are many implementations of BLAS.

    • Netlib provides a reference implementation.
    • Matlab uses Intel's MKL (mathematical kernel libaries). MKL implementation is the gold standard on market. It is not open source but the compiled library is free for Linux and MacOS.
    • Julia uses OpenBLAS. OpenBLAS is the best open source implementation.
  • There are 3 levels of BLAS functions.

Level Example Operation Name Dimension Flops
1 $\alpha \gets \mathbf{x}^T \mathbf{y}$ dot product $\mathbf{x}, \mathbf{y} \in \mathbb{R}^n$ $2n$
1 $\mathbf{y} \gets \mathbf{y} + \alpha \mathbf{x}$ axpy $\alpha \in \mathbb{R}$, $\mathbf{x}, \mathbf{y} \in \mathbb{R}^n$ $2n$
2 $\mathbf{y} \gets \mathbf{y} + \mathbf{A} \mathbf{x}$ gaxpy $\mathbf{A} \in \mathbb{R}^{m \times n}$, $\mathbf{x} \in \mathbb{R}^n$, $\mathbf{y} \in \mathbb{R}^m$ $2mn$
2 $\mathbf{A} \gets \mathbf{A} + \mathbf{y} \mathbf{x}^T$ rank one update $\mathbf{A} \in \mathbb{R}^{m \times n}$, $\mathbf{x} \in \mathbb{R}^n$, $\mathbf{y} \in \mathbb{R}^m$ $2mn$
3 $\mathbf{C} \gets \mathbf{C} + \mathbf{A} \mathbf{B}$ matrix multiplication $\mathbf{A} \in \mathbb{R}^{m \times p}$, $\mathbf{B} \in \mathbb{R}^{p \times n}$, $\mathbf{C} \in \mathbb{R}^{m \times n}$ $2mnp$
  • Typical BLAS functions support single precision (S), double precision (D), complex (C), and double complex (Z).

Examples

The form of a mathematical expression and the way the expression should be evaluated in actual practice may be quite different.

Some operations appear as level-3 but indeed are level-2.

Example 1. A common operation in statistics is column scaling or row scaling $$ \begin{eqnarray*} \mathbf{A} &=& \mathbf{A} \mathbf{D} \quad \text{(column scaling)} \\ \mathbf{A} &=& \mathbf{D} \mathbf{A} \quad \text{(row scaling)}, \end{eqnarray*} $$ where $\mathbf{D}$ is diagonal. For example, in generalized linear models (GLMs), the Fisher information matrix takes the form
$$ \mathbf{X}^T \mathbf{W} \mathbf{X}, $$ where $\mathbf{W}$ is a diagonal matrix with observation weights on diagonal.

Column and row scalings are essentially level-2 operations!

In [2]:
using BenchmarkTools, LinearAlgebra, Random

Random.seed!(123) # seed
n = 2000
A = rand(n, n) # n-by-n matrix
d = rand(n)  # n vector
D = Diagonal(d) # diagonal matrix with d as diagonal
Out[2]:
2000×2000 Diagonal{Float64, Vector{Float64}}:
 0.919181   ⋅         ⋅         ⋅        …   ⋅         ⋅          ⋅ 
  ⋅        0.426019   ⋅         ⋅            ⋅         ⋅          ⋅ 
  ⋅         ⋅        0.746586   ⋅            ⋅         ⋅          ⋅ 
  ⋅         ⋅         ⋅        0.819201      ⋅         ⋅          ⋅ 
  ⋅         ⋅         ⋅         ⋅            ⋅         ⋅          ⋅ 
  ⋅         ⋅         ⋅         ⋅        …   ⋅         ⋅          ⋅ 
  ⋅         ⋅         ⋅         ⋅            ⋅         ⋅          ⋅ 
  ⋅         ⋅         ⋅         ⋅            ⋅         ⋅          ⋅ 
  ⋅         ⋅         ⋅         ⋅            ⋅         ⋅          ⋅ 
  ⋅         ⋅         ⋅         ⋅            ⋅         ⋅          ⋅ 
  ⋅         ⋅         ⋅         ⋅        …   ⋅         ⋅          ⋅ 
  ⋅         ⋅         ⋅         ⋅            ⋅         ⋅          ⋅ 
  ⋅         ⋅         ⋅         ⋅            ⋅         ⋅          ⋅ 
 ⋮                                       ⋱                       
  ⋅         ⋅         ⋅         ⋅            ⋅         ⋅          ⋅ 
  ⋅         ⋅         ⋅         ⋅            ⋅         ⋅          ⋅ 
  ⋅         ⋅         ⋅         ⋅        …   ⋅         ⋅          ⋅ 
  ⋅         ⋅         ⋅         ⋅            ⋅         ⋅          ⋅ 
  ⋅         ⋅         ⋅         ⋅            ⋅         ⋅          ⋅ 
  ⋅         ⋅         ⋅         ⋅            ⋅         ⋅          ⋅ 
  ⋅         ⋅         ⋅         ⋅            ⋅         ⋅          ⋅ 
  ⋅         ⋅         ⋅         ⋅        …   ⋅         ⋅          ⋅ 
  ⋅         ⋅         ⋅         ⋅            ⋅         ⋅          ⋅ 
  ⋅         ⋅         ⋅         ⋅           0.572021   ⋅          ⋅ 
  ⋅         ⋅         ⋅         ⋅            ⋅        0.0403848   ⋅ 
  ⋅         ⋅         ⋅         ⋅            ⋅         ⋅         0.141618
In [3]:
Dfull = convert(Matrix, D) # convert to full matrix
Out[3]:
2000×2000 Matrix{Float64}:
 0.919181  0.0       0.0       0.0       …  0.0       0.0        0.0
 0.0       0.426019  0.0       0.0          0.0       0.0        0.0
 0.0       0.0       0.746586  0.0          0.0       0.0        0.0
 0.0       0.0       0.0       0.819201     0.0       0.0        0.0
 0.0       0.0       0.0       0.0          0.0       0.0        0.0
 0.0       0.0       0.0       0.0       …  0.0       0.0        0.0
 0.0       0.0       0.0       0.0          0.0       0.0        0.0
 0.0       0.0       0.0       0.0          0.0       0.0        0.0
 0.0       0.0       0.0       0.0          0.0       0.0        0.0
 0.0       0.0       0.0       0.0          0.0       0.0        0.0
 0.0       0.0       0.0       0.0       …  0.0       0.0        0.0
 0.0       0.0       0.0       0.0          0.0       0.0        0.0
 0.0       0.0       0.0       0.0          0.0       0.0        0.0
 ⋮                                       ⋱                       
 0.0       0.0       0.0       0.0          0.0       0.0        0.0
 0.0       0.0       0.0       0.0          0.0       0.0        0.0
 0.0       0.0       0.0       0.0       …  0.0       0.0        0.0
 0.0       0.0       0.0       0.0          0.0       0.0        0.0
 0.0       0.0       0.0       0.0          0.0       0.0        0.0
 0.0       0.0       0.0       0.0          0.0       0.0        0.0
 0.0       0.0       0.0       0.0          0.0       0.0        0.0
 0.0       0.0       0.0       0.0       …  0.0       0.0        0.0
 0.0       0.0       0.0       0.0          0.0       0.0        0.0
 0.0       0.0       0.0       0.0          0.572021  0.0        0.0
 0.0       0.0       0.0       0.0          0.0       0.0403848  0.0
 0.0       0.0       0.0       0.0          0.0       0.0        0.141618
In [4]:
# this is calling BLAS routine for matrix multiplication: O(n^3) flops
# this is SLOW!
@benchmark $A * $Dfull
Out[4]:
BenchmarkTools.Trial: 47 samples with 1 evaluation.
 Range (minmax):   99.712 ms119.247 ms   GC (min … max): 0.00% … 0.00%
 Time  (median):     105.921 ms                GC (median):    0.00%
 Time  (mean ± σ):   106.530 ms ±   4.832 ms   GC (mean ± σ):  2.19% ± 3.14%

       ▂ █               ▂   ▂   ▅                               
  ▅▁▅▁██▅█▅█▁▁█▅▁█▁▅▁▅█▅▅▁█▅▁▅█▁▅▁▅▅▁▅▁▁▁▁▁▅▁▁▁▁▁▁▁▁▁▁▁▁▅▅▁▅ ▁
  99.7 ms          Histogram: frequency by time          119 ms <

 Memory estimate: 30.52 MiB, allocs estimate: 2.
In [5]:
# dispatch to special method for diagonal matrix multiplication.
# columnwise scaling: O(n^2) flops
@benchmark $A * $D
Out[5]:
BenchmarkTools.Trial: 420 samples with 1 evaluation.
 Range (minmax):   8.169 ms21.044 ms   GC (min … max):  0.00% … 41.36%
 Time  (median):     10.001 ms               GC (median):     0.00%
 Time  (mean ± σ):   11.887 ms ±  3.421 ms   GC (mean ± σ):  19.50% ± 19.96%

           █▅                                                 
  ▄▆▇▇▅▂▂▃▆██▅▃▂▂▂▂▂▃▁▁▁▁▂▁▁▁▁▁▁▁▁▁▁▁▃▄▄▃▃▃▃▁▂▃▁▁▂▁▄▇▆▄▄▄▂▃ ▃
  8.17 ms         Histogram: frequency by time        18.2 ms <

 Memory estimate: 30.52 MiB, allocs estimate: 4.
In [6]:
# in-place: avoid allocate space for result
# rmul!: compute matrix-matrix product AB, overwriting A, and return the result.
@benchmark rmul!($A, $D)
Out[6]:
BenchmarkTools.Trial: 469 samples with 1 evaluation.
 Range (minmax):   5.331 ms22.624 ms   GC (min … max): 0.00% … 0.00%
 Time  (median):      9.766 ms               GC (median):    0.00%
 Time  (mean ± σ):   10.661 ms ±  4.561 ms   GC (mean ± σ):  0.00% ± 0.00%

    ▆█▄                                                        
  ▃████▇▃▃▃▂▁▂▂▂▄▃▂▃▄▃▄▃▃▂▂▂▂▁▂▅▃▆▅▃▂▂▁▂▃▄▃▁▃▃▂▃▂▂▁▁▂▃▃▃▄▃▂ ▂
  5.33 ms         Histogram: frequency by time        19.9 ms <

 Memory estimate: 96 bytes, allocs estimate: 2.

Note: In R or Matlab, diag(d) will create a full matrix. Be cautious using diag function: do we really need a full diagonal matrix?

In [7]:
using RCall

R"""
d <- runif(5)
diag(d)
"""
Out[7]:
RObject{RealSxp}
          [,1]      [,2]     [,3]      [,4]      [,5]
[1,] 0.3537223 0.0000000 0.000000 0.0000000 0.0000000
[2,] 0.0000000 0.3198021 0.000000 0.0000000 0.0000000
[3,] 0.0000000 0.0000000 0.372393 0.0000000 0.0000000
[4,] 0.0000000 0.0000000 0.000000 0.7502263 0.0000000
[5,] 0.0000000 0.0000000 0.000000 0.0000000 0.2864243
In [8]:
using MATLAB

mat"""
d = rand(5, 1)
diag(d)
"""
>> >> >> 
d =

    0.8147
    0.9058
    0.1270
    0.9134
    0.6324

Warning: the font "Times" is not available, so "Lucida Bright" has been substituted, but may have unexpected appearance or behavor. Re-enable the "Times" font to remove this warning.
Out[8]:
5×5 Matrix{Float64}:
 0.814724  0.0       0.0       0.0       0.0
 0.0       0.905792  0.0       0.0       0.0
 0.0       0.0       0.126987  0.0       0.0
 0.0       0.0       0.0       0.913376  0.0
 0.0       0.0       0.0       0.0       0.632359

Example 2. Innter product between two matrices $\mathbf{A}, \mathbf{B} \in \mathbb{R}^{m \times n}$ is often written as $$ \text{trace}(\mathbf{A}^T \mathbf{B}), \text{trace}(\mathbf{B} \mathbf{A}^T), \text{trace}(\mathbf{A} \mathbf{B}^T), \text{ or } \text{trace}(\mathbf{B}^T \mathbf{A}). $$ They appear as level-3 operation (matrix multiplication with $O(m^2n)$ or $O(mn^2)$ flops).

In [9]:
Random.seed!(123)
n = 2000
A, B = randn(n, n), randn(n, n)

# slow way to evaluate this thing
@benchmark tr(transpose($A) * $B)
Out[9]:
BenchmarkTools.Trial: 40 samples with 1 evaluation.
 Range (minmax):  101.115 ms179.102 ms   GC (min … max): 0.00% … 6.19%
 Time  (median):     132.417 ms                GC (median):    0.00%
 Time  (mean ± σ):   126.832 ms ±  18.911 ms   GC (mean ± σ):  1.89% ± 3.17%

  █▄    ▁   ▄           █▁▁ ▄                                
  ██▆▁▆▁█▁▆▁█▁▆▆▁▁▁▁▁▁█▁▁▆███▁█▆▁▆▆▁▁▆▆▁▁▁▁▁▁▁▁▁▁▆▁▁▁▁▁▁▁▁▁▁▆ ▁
  101 ms           Histogram: frequency by time          179 ms <

 Memory estimate: 30.52 MiB, allocs estimate: 2.

But $\text{trace}(\mathbf{A}^T \mathbf{B}) = <\text{vec}(\mathbf{A}), \text{vec}(\mathbf{B})>$. The latter is level-2 operation with $O(mn)$ flops.

In [10]:
@benchmark dot($A, $B)
Out[10]:
BenchmarkTools.Trial: 1339 samples with 1 evaluation.
 Range (minmax):  2.371 ms  5.332 ms   GC (min … max): 0.00% … 0.00%
 Time  (median):     3.691 ms                GC (median):    0.00%
 Time  (mean ± σ):   3.703 ms ± 301.899 μs   GC (mean ± σ):  0.00% ± 0.00%

                                 ▄▅▆▆▅█▄▃▃▃▃▁                 
  ▂▁▁▁▁▁▂▁▁▂▂▁▂▂▂▂▂▃▄▄▃▄▄▃▄▃▄▅▅▅▅█████████████▇▆▆▅▅▄▄▃▃▃▃▄▃▃ ▄
  2.37 ms         Histogram: frequency by time        4.47 ms <

 Memory estimate: 0 bytes, allocs estimate: 0.

Example 3. Similarly $\text{diag}(\mathbf{A}^T \mathbf{B})$ can be calculated in $O(mn)$ flops.

In [11]:
# slow way to evaluate this thing: O(n^3)
@benchmark diag(transpose($A) * $B)
Out[11]:
BenchmarkTools.Trial: 42 samples with 1 evaluation.
 Range (minmax):  102.426 ms172.579 ms   GC (min … max): 0.00% … 6.20%
 Time  (median):     113.706 ms                GC (median):    0.00%
 Time  (mean ± σ):   120.039 ms ±  15.692 ms   GC (mean ± σ):  2.10% ± 3.23%

         ▅█▂                                                     
  ▅▅▅▅██▅█████▅▅▅▅▁▅▅▅▅▁▅█▁▁▁▁▁▅▅▁▁▁▁▁▁▁▁▁▁▅▁▁▁▁▁▁▁▁▁▁▁▁▁▁▅▁▅ ▁
  102 ms           Histogram: frequency by time          173 ms <

 Memory estimate: 30.53 MiB, allocs estimate: 3.
In [12]:
# smarter: O(n^2)
@benchmark Diagonal(vec(sum($A .* $B, dims=1)))
Out[12]:
BenchmarkTools.Trial: 436 samples with 1 evaluation.
 Range (minmax):   8.197 ms20.755 ms   GC (min … max):  0.00% … 41.10%
 Time  (median):      9.322 ms               GC (median):     0.00%
 Time  (mean ± σ):   11.466 ms ±  4.034 ms   GC (mean ± σ):  19.57% ± 21.29%

      █                                                       
  ▇█▆▅█▆▇▅▄▃▃▃▁▂▃▂▁▁▁▁▁▂▁▁▁▁▁▁▁▁▂▁▁▁▁▁▁▁▃▃▃▄▃▃▃▃▂▂▄▄▅▃▃▁▃▃▃ ▃
  8.2 ms          Histogram: frequency by time        20.3 ms <

 Memory estimate: 30.53 MiB, allocs estimate: 5.

To get rid of allocation of intermediate array at all, we can just write a double loop or use dot function.

In [13]:
using LoopVectorization

function diag_matmul!(d, A, B)
    m, n = size(A)
    @assert size(B) == (m, n) "A and B should have same size"
    fill!(d, 0)
    @avx for j in 1:n, i in 1:m
        d[j] += A[i, j] * B[i, j]
    end
#     for j in 1:n
#         @views d[j] = dot(A[:, j], B[:, j])
#     end
    Diagonal(d)
end

d = zeros(eltype(A), size(A, 2))
@benchmark diag_matmul!($d, $A, $B)
Out[13]:
BenchmarkTools.Trial: 1411 samples with 1 evaluation.
 Range (minmax):  3.123 ms  5.330 ms   GC (min … max): 0.00% … 0.00%
 Time  (median):     3.485 ms                GC (median):    0.00%
 Time  (mean ± σ):   3.528 ms ± 292.772 μs   GC (mean ± σ):  0.00% ± 0.00%

     ▃▄▅▄█▂▃▁▁ ▂▄▅                                          
  ▃▆██████████████▇▆▇▇█▄▆▄▄▄▃▅▅▃▃▃▄▄▄▃▁▃▃▂▂▃▂▃▂▃▂▁▂▂▂▂▂▂▂▂ ▄
  3.12 ms         Histogram: frequency by time        4.61 ms <

 Memory estimate: 0 bytes, allocs estimate: 0.

Memory hierarchy and level-3 fraction

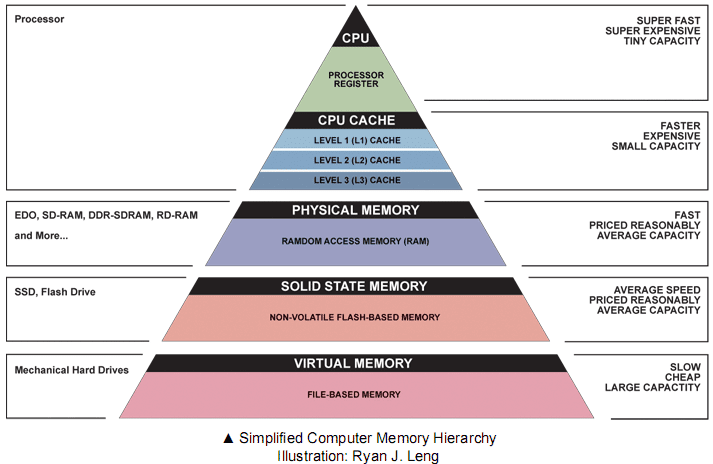
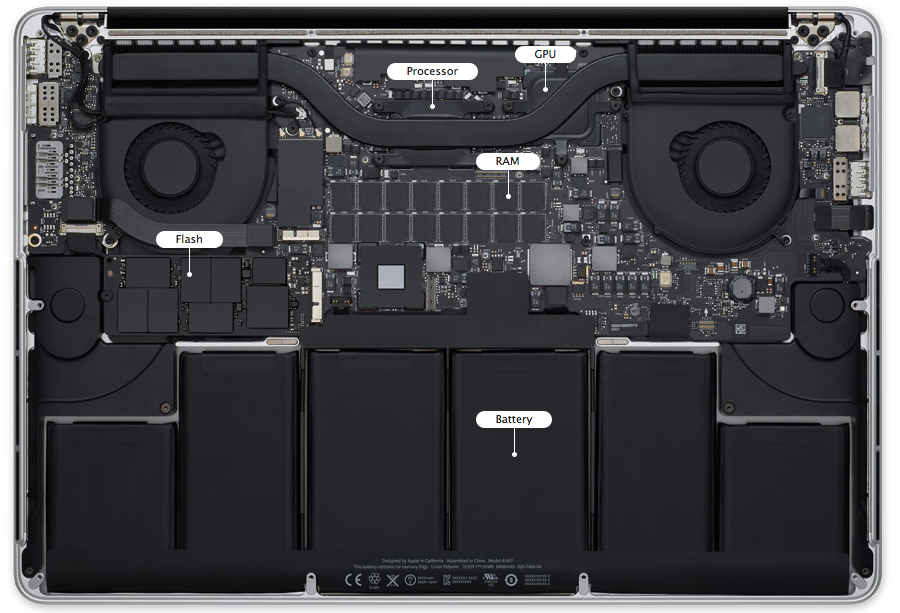
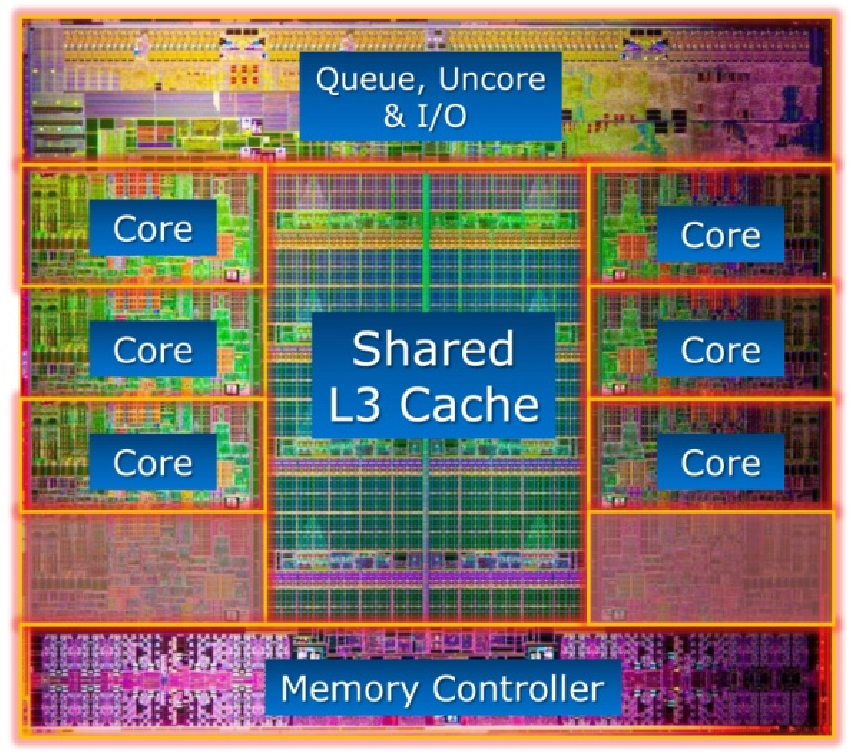
Key to high performance is effective use of memory hierarchy. True on all architectures.

  • Flop count is not the sole determinant of algorithm efficiency. Another important factor is data movement through the memory hierarchy.
  • Numbers everyone should know
Operation Time
L1 cache reference 0.5 ns
L2 cache reference 7 ns
Main memory reference 100 ns
Read 1 MB sequentially from memory 250,000 ns
Read 1 MB sequentially from SSD 1,000,000 ns
Read 1 MB sequentially from disk 20,000,000 ns

Source: https://gist.github.com/jboner/2841832

  • For example, Xeon X5650 CPU has a theoretical throughput of 128 DP GFLOPS but a max memory bandwidth of 32GB/s.

  • Can we keep CPU cores busy with enough deliveries of matrix data and ship the results to memory fast enough to avoid backlog?
    Answer: use high-level BLAS as much as possible.

BLAS Dimension Mem. Refs. Flops Ratio
Level 1: $\mathbf{y} \gets \mathbf{y} + \alpha \mathbf{x}$ $\mathbf{x}, \mathbf{y} \in \mathbb{R}^n$ $3n$ $2n$ 3:2
Level 2: $\mathbf{y} \gets \mathbf{y} + \mathbf{A} \mathbf{x}$ $\mathbf{x}, \mathbf{y} \in \mathbb{R}^n$, $\mathbf{A} \in \mathbb{R}^{n \times n}$ $n^2$ $2n^2$ 1:2
Level 3: $\mathbf{C} \gets \mathbf{C} + \mathbf{A} \mathbf{B}$ $\mathbf{A}, \mathbf{B}, \mathbf{C} \in\mathbb{R}^{n \times n}$ $4n^2$ $2n^3$ 2:n
  • Higher level BLAS (3 or 2) make more effective use of arithmetic logic units (ALU) by keeping them busy. Surface-to-volume effect.
    See Dongarra slides.
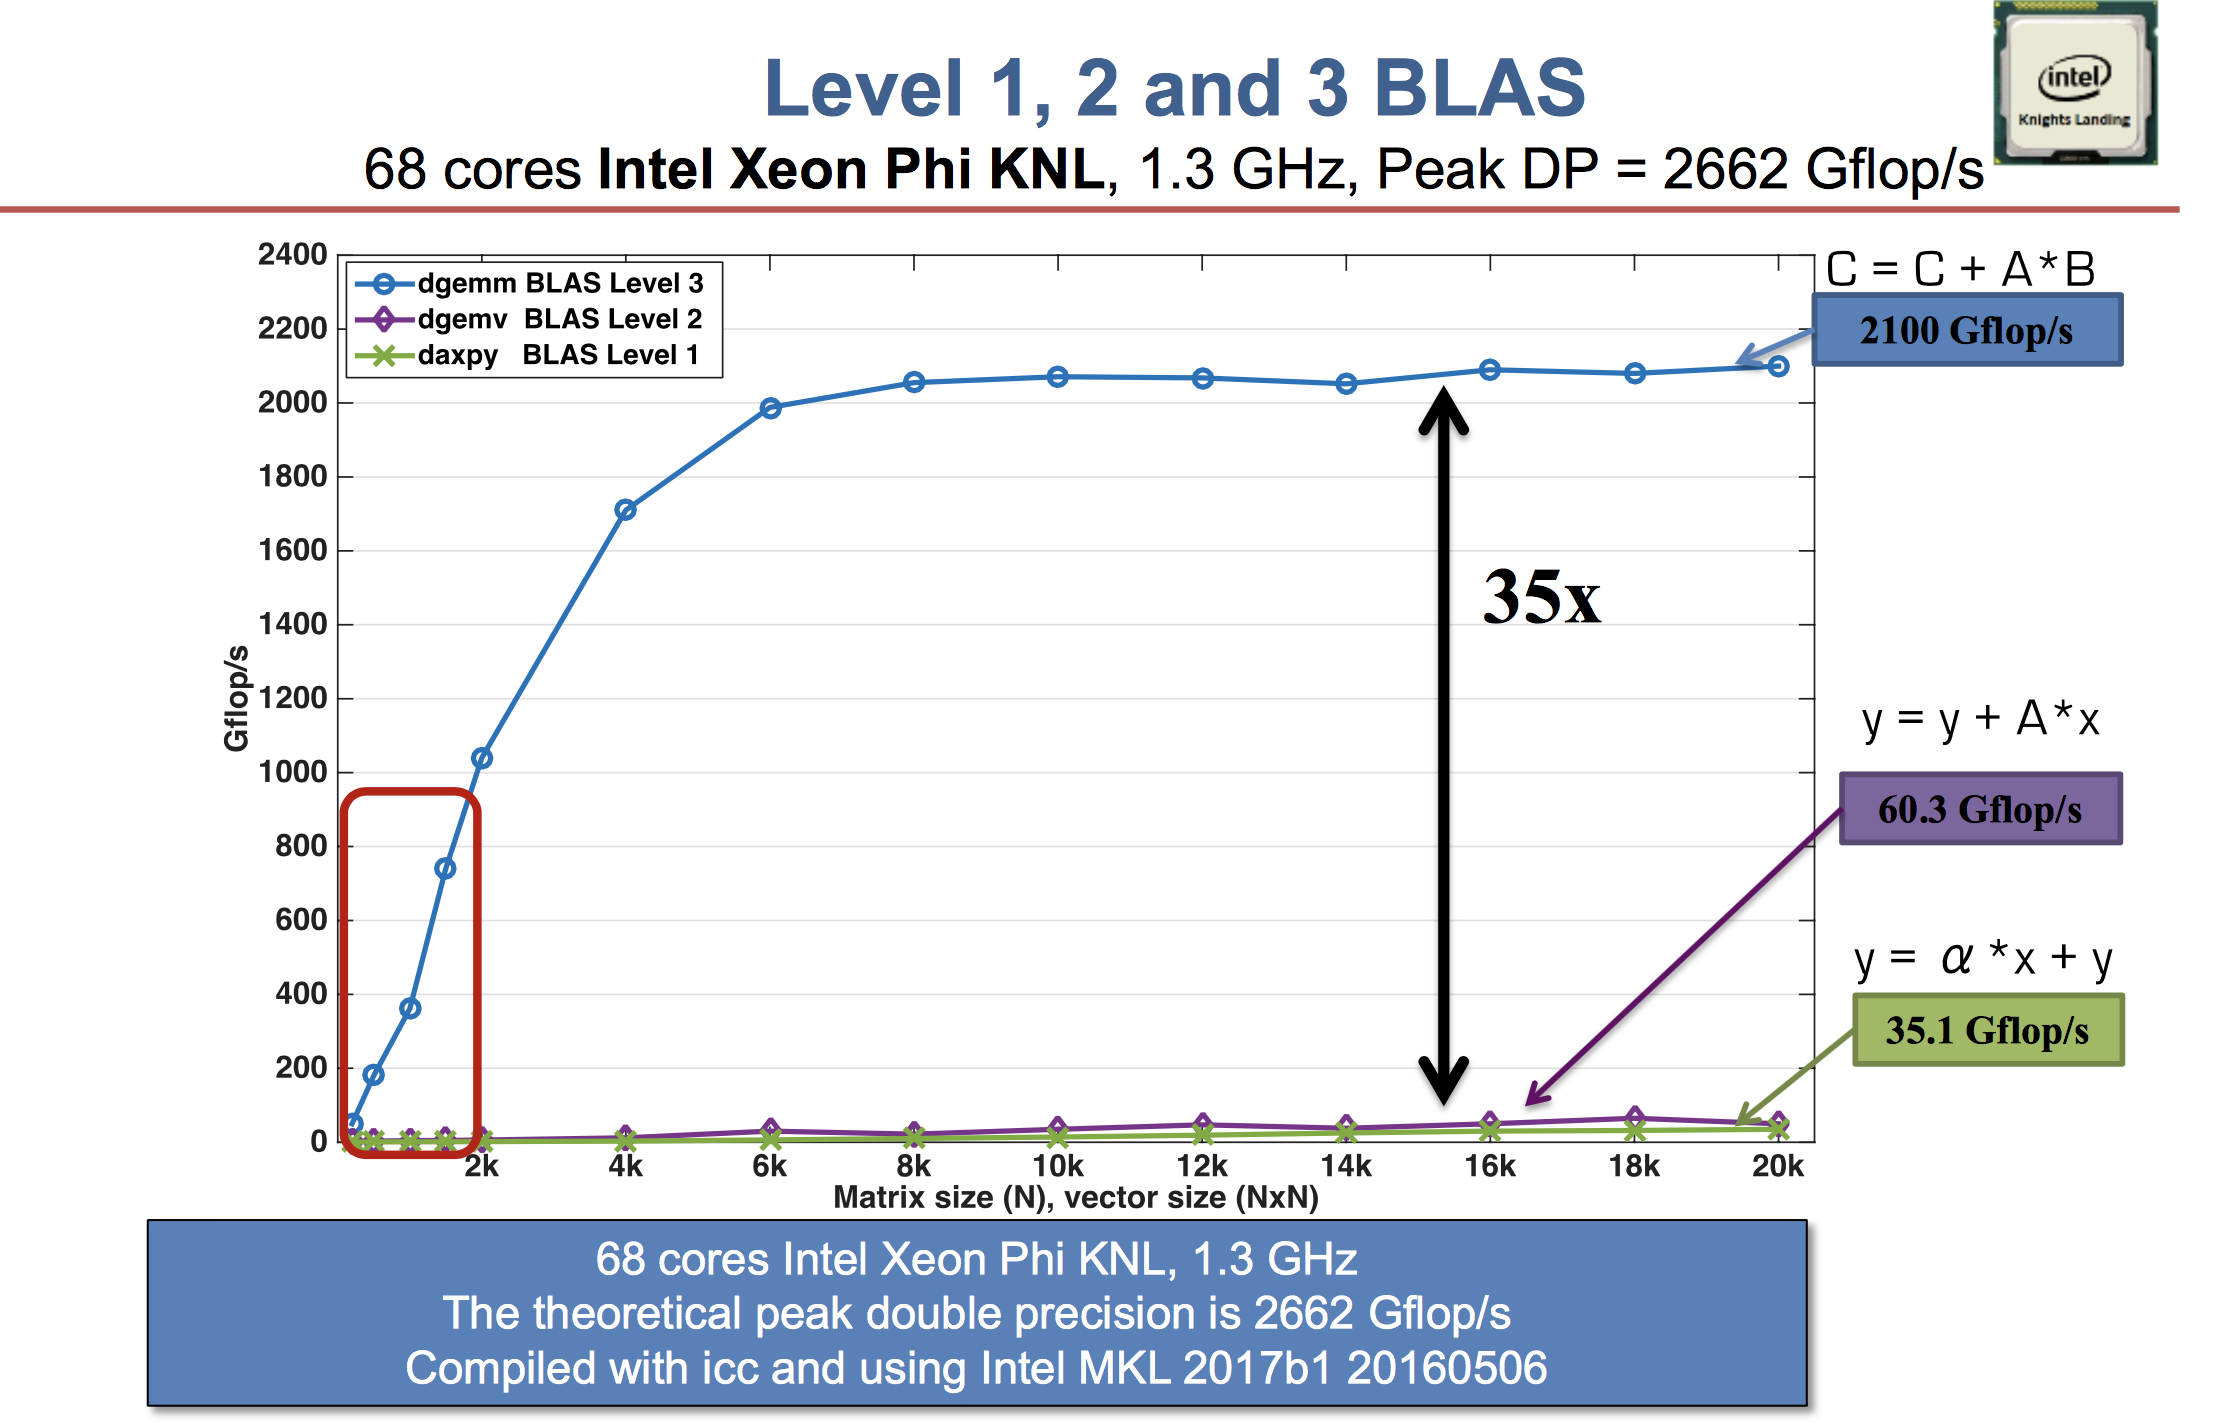
  • A distinction between LAPACK and LINPACK (older version of R uses LINPACK) is that LAPACK makes use of higher level BLAS as much as possible (usually by smart partitioning) to increase the so-called level-3 fraction.

  • To appreciate the efforts in an optimized BLAS implementation such as OpenBLAS (evolved from GotoBLAS), see the Quora question, especially the video. Bottomline is

Get familiar with (good implementations of) BLAS/LAPACK and use them as much as possible.

Effect of data layout

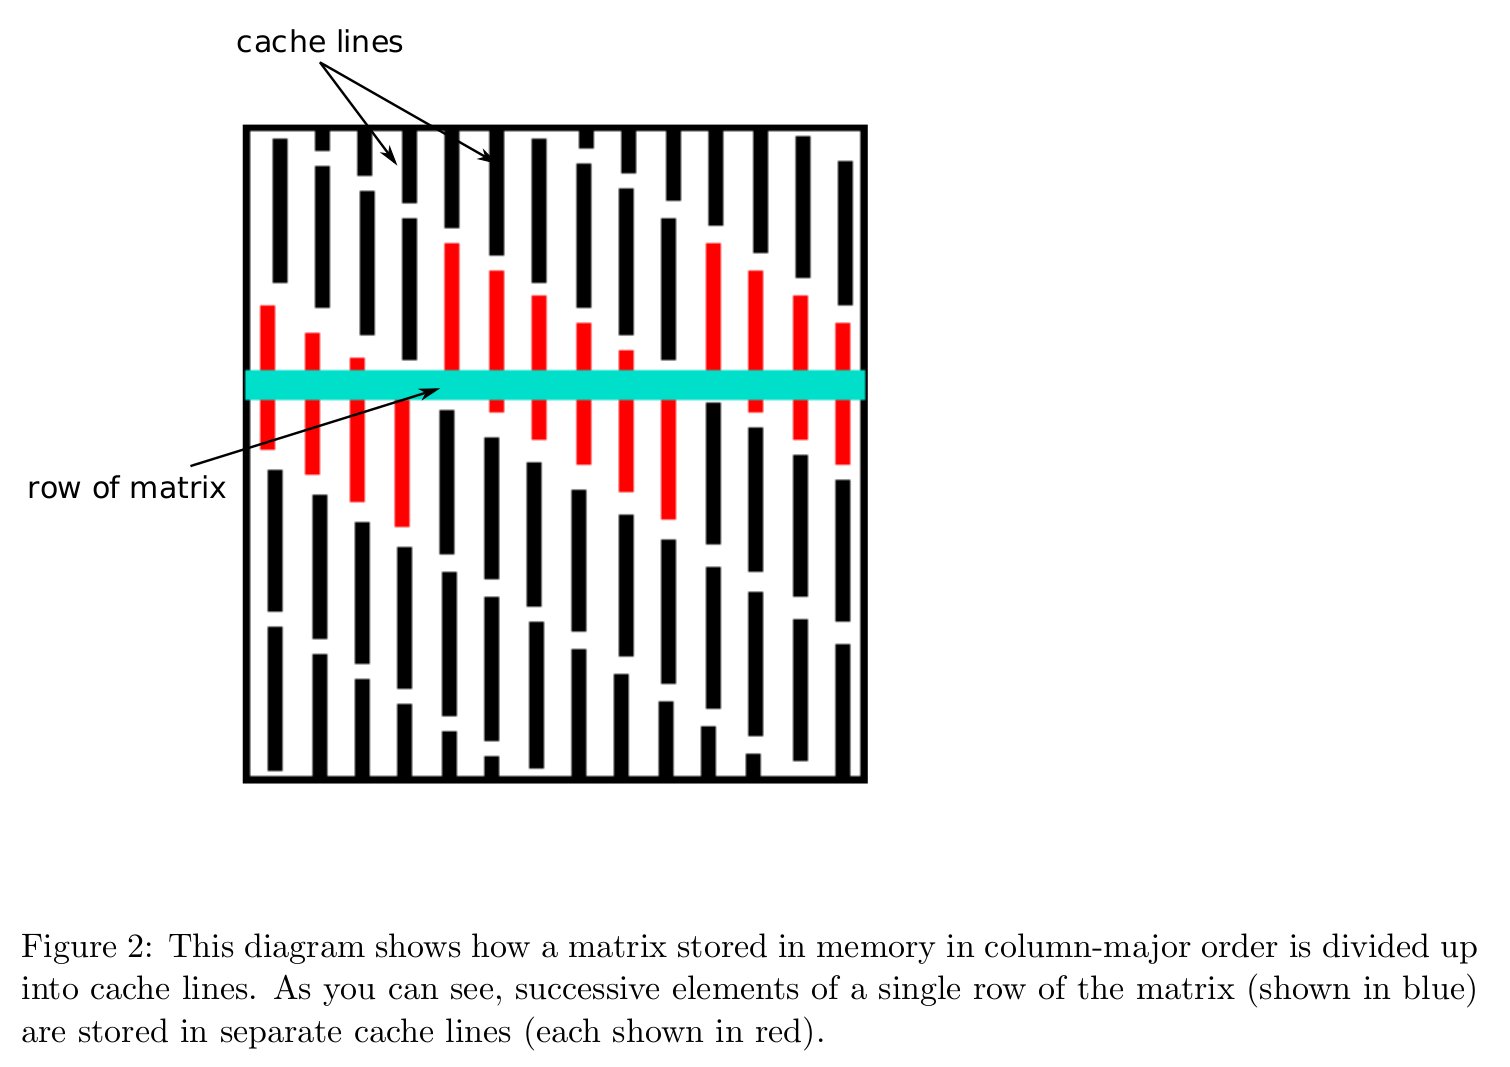
  • Data layout in memory affects algorithmic efficiency too. It is much faster to move chunks of data in memory than retrieving/writing scattered data.

  • Storage mode: column-major (Fortran, Matlab, R, Julia) vs row-major (C/C++).

  • Cache line is the minimum amount of cache which can be loaded and stored to memory.

    • x86 CPUs: 64 bytes
    • ARM CPUs: 32 bytes

  • Accessing column-major stored matrix by rows ($ij$ looping) causes lots of cache misses.

  • Take matrix multiplication as an example $$ \mathbf{C} \gets \mathbf{C} + \mathbf{A} \mathbf{B}, \quad \mathbf{A} \in \mathbb{R}^{m \times p}, \mathbf{B} \in \mathbb{R}^{p \times n}, \mathbf{C} \in \mathbb{R}^{m \times n}. $$ Assume the storage is column-major, such as in Julia. There are 6 variants of the algorithms according to the order in the triple loops.

    • jki or kji looping:
      # inner most loop
        for i = 1:m
            C[i, j] = C[i, j] + A[i, k] * B[k, j]
        end
      
    • ikj or kij looping:
      # inner most loop        
        for j = 1:n
            C[i, j] = C[i, j] + A[i, k] * B[k, j]
        end
      
    • ijk or jik looping:
      # inner most loop        
        for k = 1:p
            C[i, j] = C[i, j] + A[i, k] * B[k, j]
        end
      
  • We pay attention to the innermost loop, where the vector calculation occurs. The associated stride when accessing the three matrices in memory (assuming column-major storage) is
Variant A Stride B Stride C Stride
$jki$ or $kji$ Unit 0 Unit
$ikj$ or $kij$ 0 Non-Unit Non-Unit
$ijk$ or $jik$ Non-Unit Unit 0

Apparently the variants $jki$ or $kji$ are preferred.

In [14]:
"""
    matmul_by_loop!(A, B, C, order)

Overwrite `C` by `A * B`. `order` indicates the looping order for triple loop.
"""
function matmul_by_loop!(A::Matrix, B::Matrix, C::Matrix, order::String)
    
    m = size(A, 1)
    p = size(A, 2)
    n = size(B, 2)
    fill!(C, 0)
    
    if order == "jki"
        @inbounds for j = 1:n, k = 1:p, i = 1:m
            C[i, j] += A[i, k] * B[k, j]
        end
    end

    if order == "kji"
        @inbounds for k = 1:p, j = 1:n, i = 1:m
            C[i, j] += A[i, k] * B[k, j]
        end
    end
    
    if order == "ikj"
        @inbounds for i = 1:m, k = 1:p, j = 1:n
            C[i, j] += A[i, k] * B[k, j]
        end
    end

    if order == "kij"
        @inbounds for k = 1:p, i = 1:m, j = 1:n
            C[i, j] += A[i, k] * B[k, j]
        end
    end
    
    if order == "ijk"
        @inbounds for i = 1:m, j = 1:n, k = 1:p
            C[i, j] += A[i, k] * B[k, j]
        end
    end
    
    if order == "jik"
        @inbounds for j = 1:n, i = 1:m, k = 1:p
            C[i, j] += A[i, k] * B[k, j]
        end
    end
    
end

using Random

Random.seed!(123)
m, p, n = 2000, 100, 2000
A = rand(m, p)
B = rand(p, n)
C = zeros(m, n);
  • $jki$ and $kji$ looping:
In [15]:
using BenchmarkTools

@benchmark matmul_by_loop!($A, $B, $C, "jki")
Out[15]:
BenchmarkTools.Trial: 59 samples with 1 evaluation.
 Range (minmax):  76.814 ms94.392 ms   GC (min … max): 0.00% … 0.00%
 Time  (median):     85.880 ms               GC (median):    0.00%
 Time  (mean ± σ):   85.333 ms ±  4.472 ms   GC (mean ± σ):  0.00% ± 0.00%

       ▁    ▁▁ ▄  ▁█       ▁▄    ▁▄▄ ▄ █               ▁▁      
  ▆▁▁▁▆█▁▁▆▁██▁█▁▆██▁▆▁▁▁▁▆██▆▆▁███▆█▆█▁▁▁▁▆▁▆▆▆▁▆▁▁▁▁██▆▆▁▆ ▁
  76.8 ms         Histogram: frequency by time        93.8 ms <

 Memory estimate: 0 bytes, allocs estimate: 0.
In [16]:
@benchmark matmul_by_loop!($A, $B, $C, "kji")
Out[16]:
BenchmarkTools.Trial: 10 samples with 1 evaluation.
 Range (minmax):  474.926 ms546.306 ms   GC (min … max): 0.00% … 0.00%
 Time  (median):     501.320 ms                GC (median):    0.00%
 Time  (mean ± σ):   505.248 ms ±  20.933 ms   GC (mean ± σ):  0.00% ± 0.00%

  █       █   █      █      █      ██                   █  
  █▁▁▁▁▁▁▁█▁▁▁█▁▁▁▁▁▁█▁▁▁█▁▁▁▁▁▁█▁▁▁▁▁▁██▁▁▁▁▁▁▁▁▁▁▁▁▁▁▁▁▁▁▁█ ▁
  475 ms           Histogram: frequency by time          546 ms <

 Memory estimate: 0 bytes, allocs estimate: 0.
  • $ikj$ and $kij$ looping:
In [17]:
@benchmark matmul_by_loop!($A, $B, $C, "ikj")
Out[17]:
BenchmarkTools.Trial: 2 samples with 1 evaluation.
 Range (minmax):  2.610 s 2.624 s   GC (min … max): 0.00% … 0.00%
 Time  (median):     2.617 s              GC (median):    0.00%
 Time  (mean ± σ):   2.617 s ± 9.868 ms   GC (mean ± σ):  0.00% ± 0.00%

                              ▁▁▁▁▁▁▁▁▁▁▁▁▁▁▁▁▁▁▁▁▁▁▁▁▁▁▁▁▁▁▁▁▁▁▁▁▁▁▁▁▁▁▁▁▁▁▁▁▁▁▁▁▁█ ▁
  2.61 s        Histogram: frequency by time        2.62 s <

 Memory estimate: 0 bytes, allocs estimate: 0.
In [18]:
@benchmark matmul_by_loop!($A, $B, $C, "kij")
Out[18]:
BenchmarkTools.Trial: 2 samples with 1 evaluation.
 Range (minmax):  2.807 s 2.821 s   GC (min … max): 0.00% … 0.00%
 Time  (median):     2.814 s              GC (median):    0.00%
 Time  (mean ± σ):   2.814 s ± 9.625 ms   GC (mean ± σ):  0.00% ± 0.00%

                              ▁▁▁▁▁▁▁▁▁▁▁▁▁▁▁▁▁▁▁▁▁▁▁▁▁▁▁▁▁▁▁▁▁▁▁▁▁▁▁▁▁▁▁▁▁▁▁▁▁▁▁▁▁█ ▁
  2.81 s        Histogram: frequency by time        2.82 s <

 Memory estimate: 0 bytes, allocs estimate: 0.
  • $ijk$ and $jik$ looping:
In [19]:
@benchmark matmul_by_loop!($A, $B, $C, "ijk")
Out[19]:
BenchmarkTools.Trial: 10 samples with 1 evaluation.
 Range (minmax):  506.612 ms566.159 ms   GC (min … max): 0.00% … 0.00%
 Time  (median):     515.296 ms                GC (median):    0.00%
 Time  (mean ± σ):   523.170 ms ±  19.607 ms   GC (mean ± σ):  0.00% ± 0.00%

  ▁█   █     ▁ ▁                 ▁     ▁                      ▁  
  ██▁▁▁█▁▁▁▁█▁█▁▁▁▁▁▁▁▁▁▁▁▁▁▁▁▁█▁▁▁▁▁█▁▁▁▁▁▁▁▁▁▁▁▁▁▁▁▁▁▁▁▁▁▁█ ▁
  507 ms           Histogram: frequency by time          566 ms <

 Memory estimate: 0 bytes, allocs estimate: 0.
In [20]:
@benchmark matmul_by_loop!($A, $B, $C, "ijk")
Out[20]:
BenchmarkTools.Trial: 10 samples with 1 evaluation.
 Range (minmax):  507.129 ms561.893 ms   GC (min … max): 0.00% … 0.00%
 Time  (median):     514.035 ms                GC (median):    0.00%
 Time  (mean ± σ):   519.350 ms ±  16.527 ms   GC (mean ± σ):  0.00% ± 0.00%

  ▁ █   ▁█              ▁                               ▁  
  █▁█▁▁▁██▁▁█▁▁▁▁▁▁▁▁▁▁▁▁▁▁▁█▁▁▁▁▁▁▁▁▁▁▁▁▁▁▁▁▁▁▁▁▁▁▁▁▁▁▁▁▁▁▁█ ▁
  507 ms           Histogram: frequency by time          562 ms <

 Memory estimate: 0 bytes, allocs estimate: 0.
  • Julia wraps BLAS library for matrix multiplication. We see BLAS library wins hands down (multi-threading, Strassen algorithm, higher level-3 fraction by block outer product).
In [21]:
@benchmark mul!($C, $A, $B)
Out[21]:
BenchmarkTools.Trial: 534 samples with 1 evaluation.
 Range (minmax):  7.280 ms24.205 ms   GC (min … max): 0.00% … 0.00%
 Time  (median):     9.101 ms               GC (median):    0.00%
 Time  (mean ± σ):   9.345 ms ±  1.830 ms   GC (mean ± σ):  0.00% ± 0.00%

  ▁█▇▇▇▃▁                                                     
  ███████▅▆▅▅▃▅▄▄▃▄▃█▅▅▅▇▅▇▄█▆▅▆▆▅▅▆█▆▆▆▄▅▃▄▂▃▃▃▁▁▂▂▁▁▁▁▁▂ ▄
  7.28 ms        Histogram: frequency by time        13.7 ms <

 Memory estimate: 0 bytes, allocs estimate: 0.
In [22]:
# direct call of BLAS wrapper function
@benchmark LinearAlgebra.BLAS.gemm!('N', 'N', 1.0, $A, $B, 0.0, $C)
Out[22]:
BenchmarkTools.Trial: 635 samples with 1 evaluation.
 Range (minmax):  7.264 ms 11.183 ms   GC (min … max): 0.00% … 0.00%
 Time  (median):     7.666 ms                GC (median):    0.00%
 Time  (mean ± σ):   7.863 ms ± 605.112 μs   GC (mean ± σ):  0.00% ± 0.00%

   ▃▆▆▄▇█▃                                                  
  ▇█████████▇▆▆▄▄▄▄▃▄▄▃▃▃▃▂▄▄▃▃▃▃▂▃▃▁▁▃▃▃▂▁▂▁▁▂▂▃▃▂▂▁▂▁▂▁▂▂ ▄
  7.26 ms         Histogram: frequency by time        10.4 ms <

 Memory estimate: 0 bytes, allocs estimate: 0.

Exercise: Annotate the loop in matmul_by_loop! by @avx and benchmark again.

BLAS in R

  • Tip for R user. Standard R distribution from CRAN uses a very out-dated BLAS/LAPACK library.
In [23]:
using RCall

R"""
sessionInfo()
"""
Out[23]:
RObject{VecSxp}
R version 4.1.2 (2021-11-01)
Platform: x86_64-apple-darwin17.0 (64-bit)
Running under: macOS Big Sur 10.16

Matrix products: default
BLAS:   /Applications/Julia-1.7.app/Contents/Resources/julia/lib/julia/libblastrampoline.dylib
LAPACK: /Library/Frameworks/R.framework/Versions/4.1/Resources/lib/libRlapack.dylib

locale:
[1] en_US.UTF-8/en_US.UTF-8/en_US.UTF-8/C/en_US.UTF-8/en_US.UTF-8

attached base packages:
[1] stats     graphics  grDevices utils     datasets  methods   base     

loaded via a namespace (and not attached):
[1] compiler_4.1.2
In [24]:
R"""
library(dplyr)
library(bench)
A <- $A
B <- $B
bench::mark(A %*% B) %>%
  print(width = Inf)
""";
# A tibble: 1 × 13
  expression      min   median `itr/sec` mem_alloc `gc/sec` n_itr  n_gc
  <bch:expr> <bch:tm> <bch:tm>     <dbl> <bch:byt>    <dbl> <int> <dbl>
1 A %*% B       256ms    286ms      3.50    30.5MB     3.50     2     2
  total_time result                memory             time          
    <bch:tm> <list>                <list>             <list>        
1      571ms <dbl [2,000 × 2,000]> <Rprofmem [2 × 3]> <bench_tm [2]>
  gc              
  <list>          
1 <tibble [2 × 3]>
┌ Warning: RCall.jl: 
│ Attaching package: ‘dplyr’
│ 
│ The following objects are masked from ‘package:stats’:
│ 
│     filter, lag
│ 
│ The following objects are masked from ‘package:base’:
│ 
│     intersect, setdiff, setequal, union
│ 
└ @ RCall /Users/huazhou/.julia/packages/RCall/6kphM/src/io.jl:172
┌ Warning: RCall.jl: Warning: Some expressions had a GC in every iteration; so filtering is disabled.
└ @ RCall /Users/huazhou/.julia/packages/RCall/6kphM/src/io.jl:172
  • Re-build R from source using OpenBLAS or MKL will immediately boost linear algebra performance in R. Google build R using MKL to get started. Similarly we can build Julia using MKL.

  • Matlab uses MKL. Usually it's very hard to beat Matlab in terms of linear algebra.

In [25]:
using MATLAB

mat"""
f = @() $A * $B;
timeit(f)
"""
Out[25]:
0.0082580144345

Avoid memory allocation: some examples

  1. Transposing matrix is an expensive memory operation.
    • In R, the command
      t(A) %*% x
      
      will first transpose A then perform matrix multiplication, causing unnecessary memory allocation
    • Julia is smart to avoid transposing matrix if possible.
In [26]:
using Random, LinearAlgebra, BenchmarkTools
Random.seed!(123)

n = 1000
A = rand(n, n)
x = rand(n);
In [27]:
typeof(transpose(A))
Out[27]:
Transpose{Float64, Matrix{Float64}}
In [28]:
fieldnames(typeof(transpose(A)))
Out[28]:
(:parent,)
In [29]:
# same data in tranpose(A) and original matrix A
pointer(transpose(A).parent), pointer(A)
Out[29]:
(Ptr{Float64} @0x00007ff76a685000, Ptr{Float64} @0x00007ff76a685000)
In [30]:
# dispatch to BLAS
# does *not* actually transpose the matrix
@benchmark transpose($A) * $x
Out[30]:
BenchmarkTools.Trial: 10000 samples with 1 evaluation.
 Range (minmax):   97.560 μs665.517 μs   GC (min … max): 0.00% … 0.00%
 Time  (median):     163.091 μs                GC (median):    0.00%
 Time  (mean ± σ):   165.083 μs ±  42.142 μs   GC (mean ± σ):  0.00% ± 0.00%

        █▇           ▁▁                                         
  ▁▁▁▁▂▆██▄▃▃▄▅▅▆▆▇▆▇███▇▆▅▄▄▄▃▃▃▃▂▂▂▂▂▂▂▂▂▂▁▁▁▁▁▁▁▁▁▁▁▁▁▁▁▁▁▁ ▃
  97.6 μs          Histogram: frequency by time          311 μs <

 Memory estimate: 7.94 KiB, allocs estimate: 1.
In [31]:
# pre-allocate result
out = zeros(size(A, 2))
@benchmark mul!($out, transpose($A), $x)
Out[31]:
BenchmarkTools.Trial: 10000 samples with 1 evaluation.
 Range (minmax):   94.360 μs515.973 μs   GC (min … max): 0.00% … 0.00%
 Time  (median):     160.753 μs                GC (median):    0.00%
 Time  (mean ± σ):   162.179 μs ±  43.457 μs   GC (mean ± σ):  0.00% ± 0.00%

         █                                                       
  ▁▁▁▁▁▂▆██▂▂▂▂▂▂▃▃▃▂▂▃▅▅▄▄▃▃▃▃▂▂▂▂▂▂▂▂▂▂▂▂▂▂▂▁▁▁▁▁▁▁▁▁▁▁▁▁▁▁▁ ▂
  94.4 μs          Histogram: frequency by time          288 μs <

 Memory estimate: 0 bytes, allocs estimate: 0.
In [32]:
# or call BLAS wrapper directly
@benchmark LinearAlgebra.BLAS.gemv!('T', 1.0, $A, $x, 0.0, $out)
Out[32]:
BenchmarkTools.Trial: 10000 samples with 1 evaluation.
 Range (minmax):   93.356 μs678.983 μs   GC (min … max): 0.00% … 0.00%
 Time  (median):     121.284 μs                GC (median):    0.00%
 Time  (mean ± σ):   141.190 μs ±  38.571 μs   GC (mean ± σ):  0.00% ± 0.00%

        ▂▄▇█▃▃▂▂▁▁▁▁▁▁▂▂▂▂▁▂▂▂▂▂▂▂▁▁▁▁▁▁▁ ▁▁                  ▂
  ▂▄▆▇▇████████████████████████████████████████▇▇▆▇▆▆▆▅▆▇▅▅▆▅ █
  93.4 μs       Histogram: log(frequency) by time        272 μs <

 Memory estimate: 0 bytes, allocs estimate: 0.
In [33]:
R"""
A <- $A
x <- $x
bench::mark(t(A) %*% x) %>%
  print(width = Inf)
""";
# A tibble: 1 × 13
  expression      min   median `itr/sec` mem_alloc `gc/sec` n_itr  n_gc
  <bch:expr> <bch:tm> <bch:tm>     <dbl> <bch:byt>    <dbl> <int> <dbl>
1 t(A) %*% x   4.98ms   5.73ms      171.    7.64MB     36.4    61    13
  total_time result            memory             time           
    <bch:tm> <list>            <list>             <list>         
1      357ms <dbl [1,000 × 1]> <Rprofmem [2 × 3]> <bench_tm [74]>
  gc               
  <list>           
1 <tibble [74 × 3]>
  1. Broadcasting in Julia achieves vectorized code without creating intermediate arrays.

    Suppose we want to calculate elementsize maximum of absolute values of two large arrays. In R or Matlab, the command

    max(abs(X), abs(Y))
    

    will create two intermediate arrays and then one result array.

In [34]:
using RCall
Random.seed!(123)
X, Y = rand(1000, 1000), rand(1000, 1000)

R"""
library(dplyr)
library(bench)
bench::mark(max(abs($X), abs($Y))) %>%
  print(width = Inf)
""";
# A tibble: 1 × 13
  expression                           min   median `itr/sec` mem_alloc `gc/sec`
  <bch:expr>                      <bch:tm> <bch:tm>     <dbl> <bch:byt>    <dbl>
1 max(abs(`#JL`$X), abs(`#JL`$Y))   6.31ms   6.53ms      154.    15.3MB     159.
  n_itr  n_gc total_time result    memory             time           
  <int> <dbl>   <bch:tm> <list>    <list>             <list>         
1    29    30      189ms <dbl [1]> <Rprofmem [2 × 3]> <bench_tm [59]>
  gc               
  <list>           
1 <tibble [59 × 3]>

In Julia, dot operations are fused so no intermediate arrays are created.

In [35]:
# no intermediate arrays created, only result array created
@benchmark max.(abs.($X), abs.($Y))
Out[35]:
BenchmarkTools.Trial: 2064 samples with 1 evaluation.
 Range (minmax):  1.372 ms10.388 ms   GC (min … max):  0.00% … 82.01%
 Time  (median):     1.886 ms               GC (median):     0.00%
 Time  (mean ± σ):   2.411 ms ±  1.886 ms   GC (mean ± σ):  22.42% ± 21.26%

  ▃ ▂█▃▁                                            ▁▁       
  ██████▄▄▁▁▁▁▁▁▁▁▁▁▁▁▁▁▁▁▁▁▁▁▁▁▁▁▁▁▁▁▁▁▁▁▁▁▃▁▁▁▁▁▄███▇▅▄▅ █
  1.37 ms      Histogram: log(frequency) by time     9.81 ms <

 Memory estimate: 7.63 MiB, allocs estimate: 2.

Pre-allocating result array gets rid of memory allocation at all.

In [36]:
# no memory allocation at all!
Z = zeros(size(X)) # zero matrix of same size as X
@benchmark $Z .= max.(abs.($X), abs.($Y)) # .= (vs =) is important!
Out[36]:
BenchmarkTools.Trial: 3576 samples with 1 evaluation.
 Range (minmax):  1.220 ms  2.267 ms   GC (min … max): 0.00% … 0.00%
 Time  (median):     1.360 ms                GC (median):    0.00%
 Time  (mean ± σ):   1.389 ms ± 125.022 μs   GC (mean ± σ):  0.00% ± 0.00%

      ▃▆▄█▆▆█▅▅▅▂▁▁                                         
  ▂▅▆▇███████████████▇▅▅▄▄▃▄▄▄▃▂▂▃▃▂▃▂▂▂▂▂▂▂▂▂▁▂▂▂▂▁▂▁▁▁▂▁ ▄
  1.22 ms         Histogram: frequency by time        1.83 ms <

 Memory estimate: 0 bytes, allocs estimate: 0.
  1. View-1) avoids creating extra copy of matrix data.
In [37]:
Random.seed!(123)
A = randn(1000, 1000)

# sum entries in a sub-matrix
@benchmark sum($A[1:2:500, 1:2:500])
Out[37]:
BenchmarkTools.Trial: 10000 samples with 1 evaluation.
 Range (minmax):   68.394 μs 11.177 ms   GC (min … max):  0.00% … 96.50%
 Time  (median):     285.905 μs                GC (median):     0.00%
 Time  (mean ± σ):   328.453 μs ± 635.854 μs   GC (mean ± σ):  13.17% ±  6.64%

                           ▁▅█▇▇▅▄▄▁                            
  ▅▄▆▃▃▂▂▂▂▂▂▂▂▂▂▂▂▂▂▂▁▁▂▂▄█████████▇▇▅▅▄▄▃▃▄▃▃▃▃▃▂▂▂▂▂▂▂▂▂▂▂ ▄
  68.4 μs          Histogram: frequency by time          501 μs <

 Memory estimate: 488.36 KiB, allocs estimate: 2.
In [38]:
# view avoids creating a separate sub-matrix
@benchmark sum(@view $A[1:2:500, 1:2:500])
Out[38]:
BenchmarkTools.Trial: 6908 samples with 1 evaluation.
 Range (minmax):  685.454 μs 1.483 ms   GC (min … max): 0.00% … 0.00%
 Time  (median):     708.476 μs               GC (median):    0.00%
 Time  (mean ± σ):   720.608 μs ± 51.284 μs   GC (mean ± σ):  0.00% ± 0.00%

  █▆  ▂▅▃▂▂▁▂▂▂▁▂▁▁▁▁ ▁                                      ▁
  ███████████████████████████▇▇█▇▇▇▆▆▇▇▆▆▆▆▅▄▆▄▅▅▅▅▄▄▅▅▅▅▆▄▃ █
  685 μs        Histogram: log(frequency) by time       941 μs <

 Memory estimate: 0 bytes, allocs estimate: 0.

The @views macro, which can be useful in some operations.

In [39]:
@benchmark @views sum($A[1:2:500, 1:2:500])
Out[39]:
BenchmarkTools.Trial: 6981 samples with 1 evaluation.
 Range (minmax):  685.281 μs 1.197 ms   GC (min … max): 0.00% … 0.00%
 Time  (median):     691.028 μs               GC (median):    0.00%
 Time  (mean ± σ):   713.383 μs ± 47.992 μs   GC (mean ± σ):  0.00% ± 0.00%

  █▃  ▅▆ ▁▁▂▁▁▁▁▁▁▁▁                                         ▁
  ███████████████████████████▇▇▇▇▆▆▇▇▆▆▆▄▆▅▄▅▅▄▄▆▆▅▅▄▅▅▅▄▃▄▅ █
  685 μs        Histogram: log(frequency) by time       915 μs <

 Memory estimate: 0 bytes, allocs estimate: 0.