Plotting in Julia

Warning: The time to first plot can be frustratingly long in Julia because of the JIT compilation.

The four most popular options (as far as I know) in Julia are

Gadfly.jl

To demonstrate Gadfly, we will go through an example and compare it to ggplot2.

In [1]:
using RCall

R"""
library(ggplot2)
library(dplyr)

df <- ToothGrowth %>%
  group_by(supp, dose) %>%
  summarise(se = sd(len) / n(), len = mean(len), n = n())

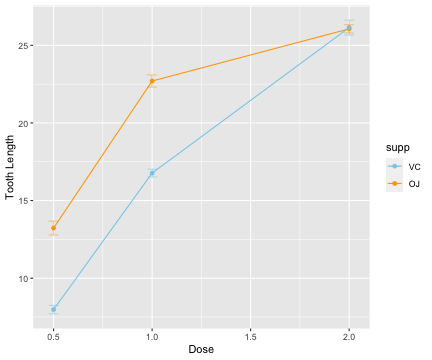
ggplot(df, aes(x = dose, y = len, group = supp, color = supp)) + 
  geom_line() +
  geom_point() +
  geom_errorbar(aes(ymin = len - se, ymax = len + se), width = 0.1, alpha = 0.5,
  position = position_dodge(0.005)) +  
  scale_color_manual(values = c(VC = "skyblue", OJ = "orange")) + 
  labs(x = "Dose", y = "Tooth Length")
"""
┌ Warning: RCall.jl: 
│ Attaching package: ‘dplyr’
│ 
│ The following objects are masked from ‘package:stats’:
│ 
│     filter, lag
│ 
│ The following objects are masked from ‘package:base’:
│ 
│     intersect, setdiff, setequal, union
│ 
└ @ RCall /Users/huazhou/.julia/packages/RCall/6kphM/src/io.jl:172
┌ Warning: RCall.jl: `summarise()` has grouped output by 'supp'. You can override using the `.groups` argument.
└ @ RCall /Users/huazhou/.julia/packages/RCall/6kphM/src/io.jl:172
Out[1]:
RObject{VecSxp}
In [2]:
@rget df # retrieve dataframe from R to Julia workspace
using Gadfly
df[!, :ymin] = df[!, :len] - df[!, :se]
df[!, :ymax] = df[!, :len] + df[!, :se]
Gadfly.plot(df, 
    x = :dose, 
    y = :len, 
    color = :supp, 
    Geom.point,
    Guide.xlabel("Dose"), 
    Guide.ylabel("Tooth Length"), 
    Guide.xticks(ticks = [0.5, 1.0, 1.5, 2.0]),
    Geom.line, 
    Geom.errorbar, 
    ymin = :ymin, 
    ymax = :ymax, 
    Scale.color_discrete_manual("orange", "skyblue"))
Out[2]:
Dose 0.5 1.0 1.5 2.0 OJ VC supp h,j,k,l,arrows,drag to pan i,o,+,-,scroll,shift-drag to zoom r,dbl-click to reset c for coordinates ? for help ? -40 -30 -20 -10 0 10 20 30 40 50 60 70 -30 -28 -26 -24 -22 -20 -18 -16 -14 -12 -10 -8 -6 -4 -2 0 2 4 6 8 10 12 14 16 18 20 22 24 26 28 30 32 34 36 38 40 42 44 46 48 50 52 54 56 58 60 -30 0 30 60 -30 -29 -28 -27 -26 -25 -24 -23 -22 -21 -20 -19 -18 -17 -16 -15 -14 -13 -12 -11 -10 -9 -8 -7 -6 -5 -4 -3 -2 -1 0 1 2 3 4 5 6 7 8 9 10 11 12 13 14 15 16 17 18 19 20 21 22 23 24 25 26 27 28 29 30 31 32 33 34 35 36 37 38 39 40 41 42 43 44 45 46 47 48 49 50 51 52 53 54 55 56 57 58 59 60 Tooth Length

Both offer more customized options

In [3]:
R"""
ggplot(df, aes(x = dose, y = len, group = supp, color = supp)) + 
  geom_line() +
  geom_point() +
  geom_errorbar(aes(ymin = len - se, ymax = len + se), width = 0.1, alpha = 0.5, 
    position = position_dodge(0.005)) + 
    theme(legend.position = c(0.8,0.1), 
    legend.key = element_blank(), 
    axis.text.x = element_text(angle = 0, size = 11), 
    axis.ticks = element_blank(), 
    panel.grid.major = element_blank(), 
    legend.text=element_text(size = 11),
    panel.border = element_blank(), 
    panel.grid.minor = element_blank(), 
    panel.background = element_blank(), 
    axis.line = element_line(color = 'black',size = 0.3), 
  plot.title = element_text(hjust = 0.5)) + 
  scale_color_manual(values = c(VC = "skyblue", OJ = "orange")) + 
  labs(x = "Dose", y = "Tooth Length")
"""
Out[3]:
RObject{VecSxp}
In [4]:
Gadfly.plot(df, x = :dose, y = :len, color = :supp, Geom.point,
    Guide.xlabel("Dose"), Guide.ylabel("Tooth Length"), 
    Guide.xticks(ticks = [0.5, 1.0, 1.5, 2.0]),
    Theme(panel_fill = nothing, highlight_width = 0mm, point_size = 0.5mm,
    key_position = :inside, 
    grid_line_width = 0mm, panel_stroke = colorant"black"),
    Geom.line, Geom.errorbar, ymin = :ymin, ymax = :ymax, 
    Scale.color_discrete_manual("orange", "skyblue"))
Out[4]:
Dose 0.5 1.0 1.5 2.0 OJ VC supp h,j,k,l,arrows,drag to pan i,o,+,-,scroll,shift-drag to zoom r,dbl-click to reset c for coordinates ? for help ? -40 -30 -20 -10 0 10 20 30 40 50 60 70 -30 -28 -26 -24 -22 -20 -18 -16 -14 -12 -10 -8 -6 -4 -2 0 2 4 6 8 10 12 14 16 18 20 22 24 26 28 30 32 34 36 38 40 42 44 46 48 50 52 54 56 58 60 -30 0 30 60 -30 -29 -28 -27 -26 -25 -24 -23 -22 -21 -20 -19 -18 -17 -16 -15 -14 -13 -12 -11 -10 -9 -8 -7 -6 -5 -4 -3 -2 -1 0 1 2 3 4 5 6 7 8 9 10 11 12 13 14 15 16 17 18 19 20 21 22 23 24 25 26 27 28 29 30 31 32 33 34 35 36 37 38 39 40 41 42 43 44 45 46 47 48 49 50 51 52 53 54 55 56 57 58 59 60 Tooth Length

Plots.jl

We demonstrate Plots.jl below:

In [5]:
# Pkg.add("Plots")
using Plots, Random

Random.seed!(123) # set seed
x = cumsum(randn(50, 2), dims=1);
In [6]:
# Pkg.add("PyPlot")
pyplot()  # set the backend to PyPlot
Plots.plot(x, title="Random walk", xlab="time")
┌ Warning: You are using Matplotlib 3.2.1, which is no longer
│ officialy supported by the Plots community. To ensure smooth Plots.jl
│ integration update your Matplotlib library to a version >= 3.4.0
│ 
│ If you have used Conda.jl to install PyPlot (default installation),
│ upgrade your matplotlib via Conda.jl and rebuild the PyPlot.
│ 
│ If you are not sure, here are the default instructions:
│ 
│ In Julia REPL:
│ ```
│ import Pkg;
│ Pkg.add("Conda")
│ import Conda
│ Conda.update()
│ Pkg.build("PyPlot")
│ ```
│ 
└ @ Plots /Users/huazhou/.julia/packages/Plots/tXtrW/src/backends/pyplot.jl:29
KeyError: key "set_math_fontfamily" not found

Stacktrace:
  [1] __getproperty
    @ ~/.julia/packages/PyCall/7a7w0/src/PyCall.jl:307 [inlined]
  [2] getproperty(o::PyCall.PyObject, s::String)
    @ PyCall ~/.julia/packages/PyCall/7a7w0/src/PyCall.jl:311
  [3] _before_layout_calcs(plt::Plots.Plot{Plots.PyPlotBackend})
    @ Plots ~/.julia/packages/Plots/tXtrW/src/backends/pyplot.jl:1064
  [4] prepare_output(plt::Plots.Plot{Plots.PyPlotBackend})
    @ Plots ~/.julia/packages/Plots/tXtrW/src/plot.jl:217
  [5] show(io::Base64.Base64EncodePipe, m::MIME{Symbol("image/png")}, plt::Plots.Plot{Plots.PyPlotBackend})
    @ Plots ~/.julia/packages/Plots/tXtrW/src/output.jl:204
  [6] base64encode(::Function, ::MIME{Symbol("image/png")}, ::Vararg{Any}; context::Nothing)
    @ Base64 /Applications/Julia-1.7.app/Contents/Resources/julia/share/julia/stdlib/v1.7/Base64/src/encode.jl:209
  [7] base64encode
    @ /Applications/Julia-1.7.app/Contents/Resources/julia/share/julia/stdlib/v1.7/Base64/src/encode.jl:206 [inlined]
  [8] _ijulia_display_dict(plt::Plots.Plot{Plots.PyPlotBackend})
    @ Plots ~/.julia/packages/Plots/tXtrW/src/ijulia.jl:44
  [9] display_dict(plt::Plots.Plot{Plots.PyPlotBackend})
    @ Plots ~/.julia/packages/Plots/tXtrW/src/init.jl:92
 [10] #invokelatest#2
    @ ./essentials.jl:716 [inlined]
 [11] invokelatest
    @ ./essentials.jl:714 [inlined]
 [12] execute_request(socket::ZMQ.Socket, msg::IJulia.Msg)
    @ IJulia ~/.julia/packages/IJulia/e8kqU/src/execute_request.jl:112
 [13] #invokelatest#2
    @ ./essentials.jl:716 [inlined]
 [14] invokelatest
    @ ./essentials.jl:714 [inlined]
 [15] eventloop(socket::ZMQ.Socket)
    @ IJulia ~/.julia/packages/IJulia/e8kqU/src/eventloop.jl:8
 [16] (::IJulia.var"#15#18")()
    @ IJulia ./task.jl:423
In [ ]:
gr()   # change backend to GR
Plots.plot(x, title="Random walk", xlab="time")
gr()
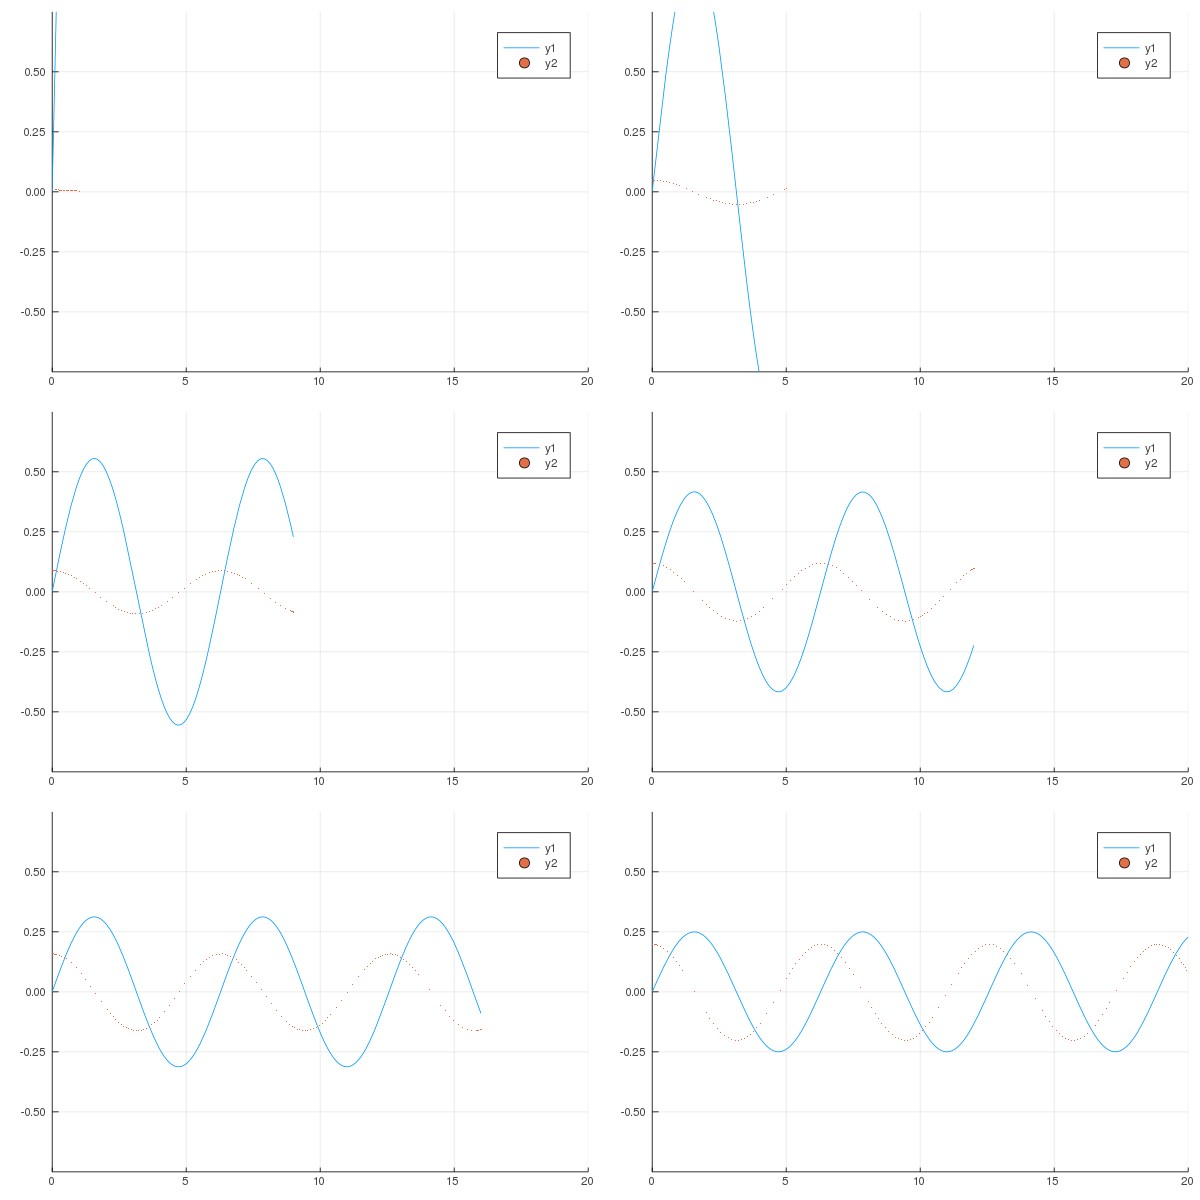
@gif for i in 1:20
    Plots.plot(x -> sin(x) / (.2i), 0, i, xlim=(0, 20), ylim=(-.75, .75))
    scatter!(x -> cos(x) * .01 * i, 0, i, m=1)
end;

produces following animation.

In [ ]:
# Pkg.add("PlotlyJS")
plotlyjs()  # change backend to PlotlyJS
Plots.plot(x, title="Random walk", xlab="time")